Straight-line Graphs

Introducing the connection between linear equations and straight-line graphs
Publisher: Texas Instruments UK
Editor: Barrie Galpin
Author: Jay Timotheus
Topic: Matematik
Tags Linjär , Mönster , Funktioner
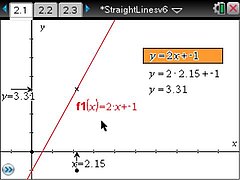
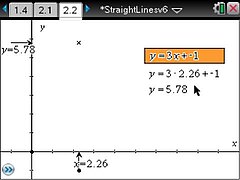
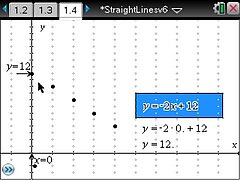
The activity begins by revising how, using a linear equation, values of y are calculated for particular values of x, and how these values, when plotted on coordinate axes, form points that always lie on a straight line. Moving from discrete to continuous values of x, students are asked first to visualise straight lines and then to draw them by entering functions.
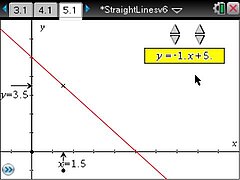
There is then an investigation of the effect on the graph of changing the values of m and c in the equation y=mx+c. In a final section, students reinforce their understanding by moving a straight line around and seeing the automatically produced linear equation.
This activity forms part of the OxBox, published by Oxford University Press to support their course 'Oxford GCSE Maths'. http://www.oup.com/oxed/secondary/2010gcse/


